Reports & Dashboards

The right report, for the right decision-maker.

Built-in analytics, configurable Excel reports, Power BI dashboards and portfolio views. Aidi gives every level of your organization the data it needs, in the format it already uses.

Book a demoExplore the dashboard
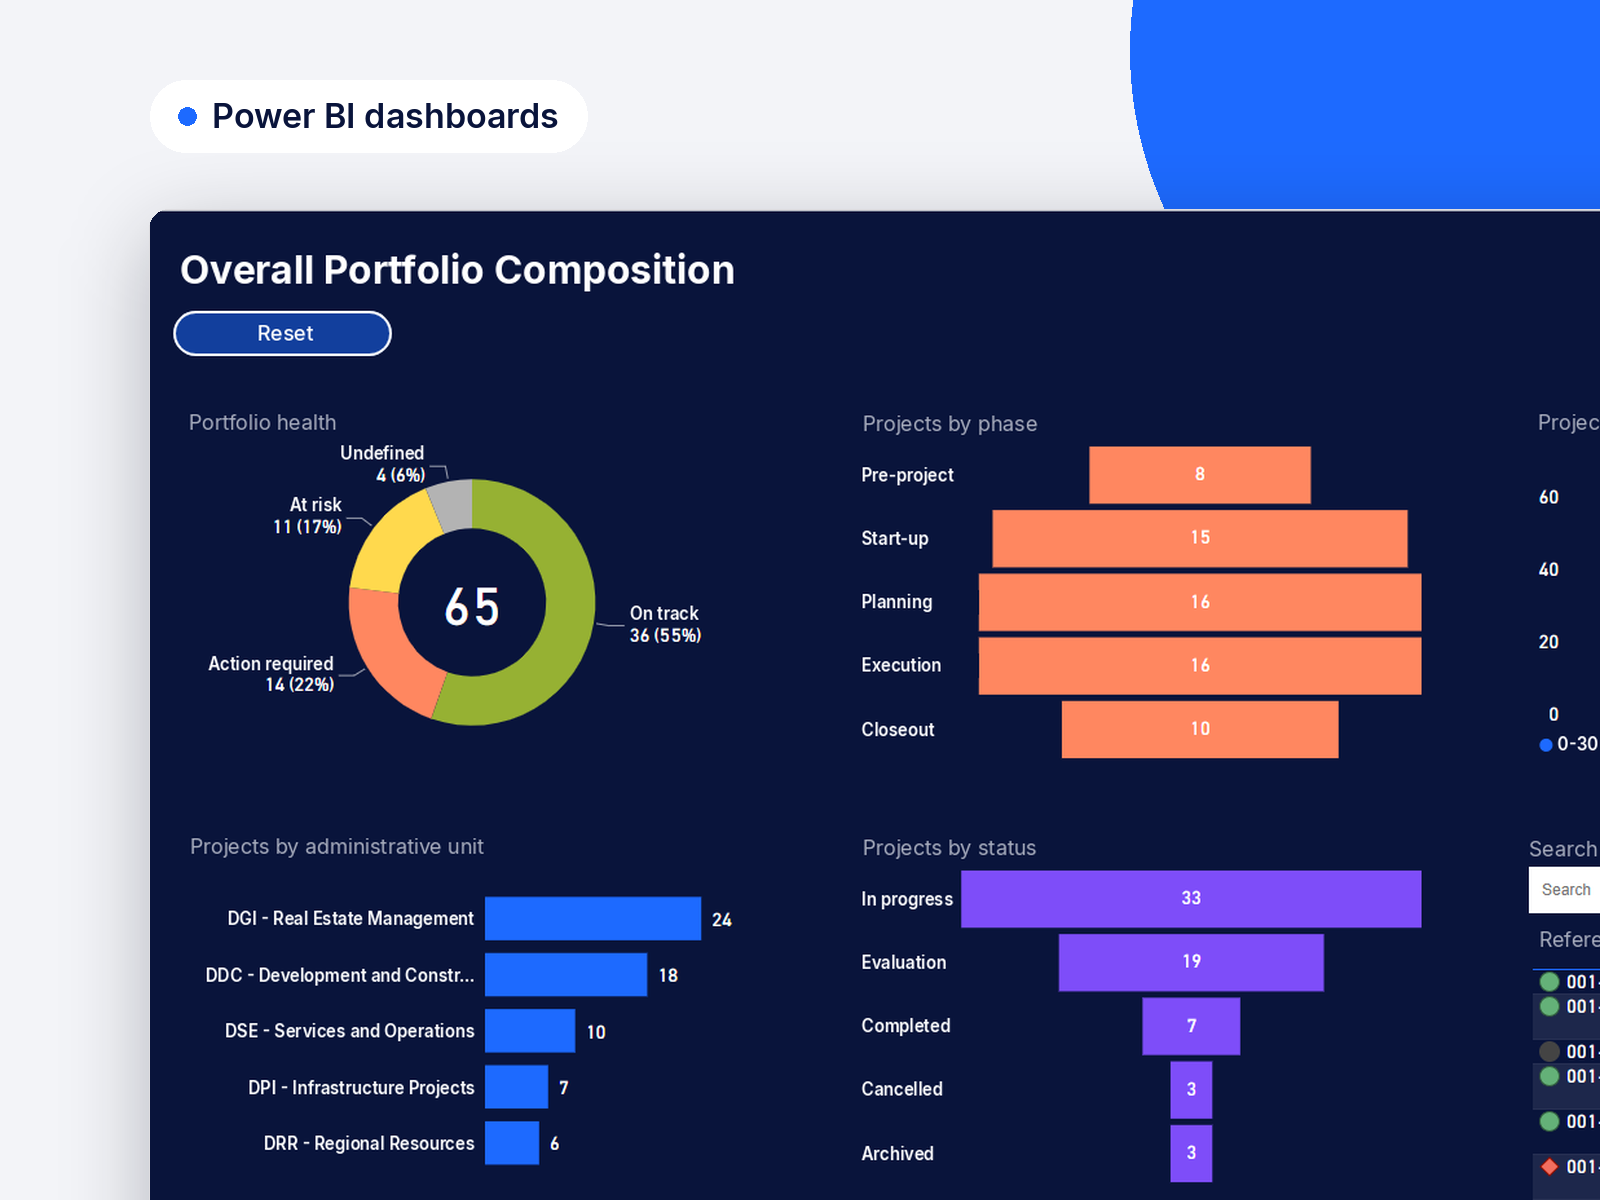
Aidi reporting dashboard — capital project cost summary and Power BI analytics
verified_user
SOC 2 Type II Certified
auto_awesome
Built-in AI Capabilities
flag
Made in Canada
compare_arrows
Alternative to MS Project

Your portfolio, live. Explore the dashboard

Connected to Power BI
Filter by All projects In control Action required At risk
Projects
65
full portfolio
Total budget
$120.0M
funding: $134.4M
In control
36
55%
At risk
11
17%
Portfolio health
In control55%
Action req.22%
At risk17%
Undefined6%
Projects by phase
Pre-project
8
Start
15
Planning
16
Execution
16
Closure
10
By status
In progress
33
Evaluation
19
Completed
7
Cancelled
3
By administrative unit
DGI
24
24
DDC
18
18
DSE
10
10
DPI
7
7
DRR
6
6
Project updates
Commitment rate
56%
vs allocated budget
CPI Costs
97%
within norms
SPI Schedule
131%
overrun
Tender variance
46.0%
vs estimate
Budget · Trend · Actuals · Projected ($M)
Budget $120MTrend $116MProjected $9.1MActuals $38M
Predictability
Costs
67%
Schedule
28%
Tender gap
46%
Cumulative cashflow — 2024–2030
Contingency used
28%
remaining: 72%
Amendments 2026
$1.59M
5 approved change orders
Holdbacks outstanding
$2.8M
to release at closure
Approval turnaround
6–10 d
33% of files
Modification causes
Site conditions 31%
Client request 29%
Coordination 15%
Error/Omission 14%
Other 9%
Approved amendments
Approval delays (%)
Connect Aidi to Power BI nativelyYour project data feeds your dashboards automatically.

Every insight, at the right level, in the right format.

bar_chart

Cost Summary

Budget, commitments, payments and balances, line by line, in real time. The essential view for project managers and financial controllers.
table_chart

Report Center

A library of pre-built, configurable Excel reports. Generate, filter and export in a few clicks, for audits, accountability reporting and external sharing.
bolt

Analytics & Power BI

Built-in indicators in Aidi, Power BI dashboards and portfolio views. Your project data cross-referenced with your financial systems, in the tool your leadership already uses.
Built-in Reporting

Full financial detail on every project, without leaving Aidi.

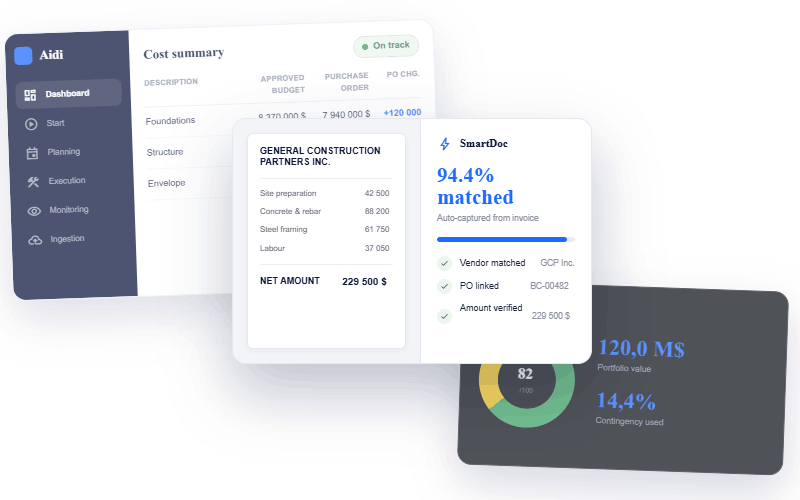
Aidi's Cost Summary centralizes original budget, revisions, contractual commitments, purchase orders, payments made and available balance, structured by phase and budget line. A view directly accessible in the platform, updated in real time, ready to share with financial leadership.

Aidi Cost Summary
Reports & Analytics

From operational tracking to executive dashboards.

Aidi offers multiple levels of analysis depending on the need: pre-configured performance indicators built into the platform, configurable Excel reports through the Report Center, and Power BI dashboards to cross-reference project data with financial systems. Each level serves a different audience, from project manager to executive.

Aidi Analytics, Report Center and Power BI

FAQ

Do we need a Power BI license to use Aidi's reporting?
keyboard_arrow_down

No. Aidi includes built-in analytics that do not require Power BI: cost summaries, project health views, approval delay tracking, portfolio dashboards, and a Report Center with configurable Excel exports are all available directly in the platform.

Power BI integration is available for organizations that want to extend their reporting further, combine Aidi data with other business systems, or provide executives with dashboards they already use.

How does the Power BI connector work?
keyboard_arrow_down

Aidi provides a native Power BI connector: no custom development is required.

Once connected, your project data (budgets, contracts, cashflows, portfolio health, approval timelines) feeds your Power BI dashboards automatically, without manual exports or scheduled data refreshes.

Can we produce reports for elected officials or board members?
keyboard_arrow_down

Yes. Aidi's reporting tools are designed for multiple audiences simultaneously.

  • Project teams work with detailed cost summaries and approval tracking.
  • Portfolio managers access consolidated dashboards across all active projects.
  • Executives and elected officials receive high-level capital plan performance reports,

all generated from the same live data, with no manual report preparation.

Can reports be exported to Excel?
keyboard_arrow_down

Yes. Aidi's Report Center includes a configurable library of reports that export to Excel. You can customize filters and then export on demand or schedule recurring exports for regular stakeholder reporting.
See your own data in a live dashboard.